R, Scientometrics, Knowledge Management, and Social Network Analysis

Germany pass-networks (against Australia) – 2010 FIFA World Cup

with 11 comments

Germany won its first game in 2010 FIFA World Cup against Australia 4:0.

Inspired by what FAS.research did in visualizing the pass-network of soccer matches (there are a number of matches from the 2010 FIFA World Cup as well), here is the Germany pass-network against Australia.

Here are the number of passes completed by each German players:

  • Philipp LAHM – 71 pass(es)
  • Arne FRIEDRICH – 68 pass(es)
  • Per MERTESACKER – 64 pass(es)
  • Bastian SCHWEINSTEIGER – 54 pass(es)
  • Holger BADSTUBER – 47 pass(es)
  • Sami KHEDIRA – 41 pass(es)
  • Thomas MUELLER – 34 pass(es)
  • Manuel NEUER – 24 pass(es)
  • Mesut OEZIL – 24 pass(es)
  • Lukas PODOLSKI – 15 pass(es)
  • Miroslav KLOSE – 7 pass(es)
  • CACAU – 5 pass(es)
  • Mario GOMEZ – 1 pass(es)
  • Marko MARIN – 1 pass(es)

The defenders contributed 250 out of 456 passes (54.8%)!

And the following are the number of passes received by each player:

  • Arne FRIEDRICH – receive 63 pass(es)
  • Per MERTESACKER – receive 60 pass(es)
  • Bastian SCHWEINSTEIGER – receive 59 pass(es)
  • Philipp LAHM – receive 58 pass(es)
  • Thomas MUELLER – receive 42 pass(es)
  • Sami KHEDIRA – receive 40 pass(es)
  • Lukas PODOLSKI – receive 34 pass(es)
  • Holger BADSTUBER – receive 33 pass(es)
  • Mesut OEZIL – receive 31 pass(es)
  • Miroslav KLOSE – receive 14 pass(es)
  • Manuel NEUER – receive 12 pass(es)
  • CACAU – receive 10 pass(es)
  • Mario GOMEZ – receive 6 pass(es)
  • Marko MARIN – receive 4 pass(es)

Passes to defenders 45.9%, midfielders (Schweinsteiger, Khedira, Oezil and Gomez) 29.2%, forwards (Klose, Cacau, Podolski, Marin and Mueller) 22.3%.

Source of inspiration: FAS Research

Written by Mat

July 4, 2010 at 10:23 pm

A simple network analysis on hedge fund holdings

with one comment

I’ve been following the website Financial Network Analysis lately. Wanting to get my hands dirty, I tried to generate simple network map of hedge fund holdings.

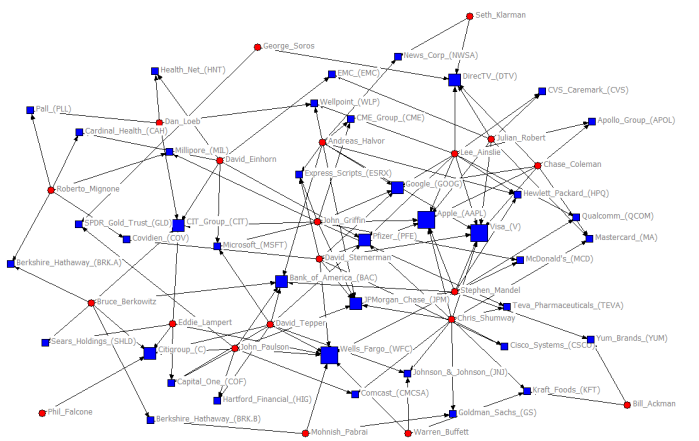
Based on the hedge fund portfolio tracker compiled by marketfolly, I constructed a network map of some stocks which are held by at least two hedge funds.

Here are the list of hedge funds tracked:

  • Appaloosa Management (David Tepper)
  • Baupost Group (Seth Klarman)
  • Berkshire Hatheway (Warren Buffett)
  • Blue Ridge Capital (John Griffin)
  • Bridger Management (Roberto Mignone)
  • Conatus Capital (David Stemerman)
  • Fairholme Capital Management (Bruce Berkowitz)
  • Greenlight Capital (David Einhorn)
  • Harbinger Capital Partners (Phil Falcone)
  • Lone Pine Capital (Stephen Mandel)
  • Maverick Capital (Lee Ainslie)
  • Pabrai Investment Fund (Mohnish Pabrai)
  • Paulson & Co (John Paulson)
  • Pershing Square Capital Management (Bill Ackman)
  • RBS Partners (Eddie Lampert)
  • Shumway Capital Partners (Chris Shumway)
  • Soros Fund Management (George Soros)
  • Third Point LLC (Dan Loeb)
  • Tiger Global (Chase Coleman)
  • Tiger Management (Julian Robertson)
  • Viking Global (Andreas Halvorsen)

The red nodes are the fund managers for each hedge fund. The bigger the size of the node of a stock (blue nodes) means that the stock are held by more hedge funds. Here is the network map (click on the image for larger size):

As can be seen Apple, Wells Fargo, and Visa are held by the most hedge funds (7 to be exact).

Written by Mat

June 14, 2010 at 1:44 pm

Directorship Interlocks among US 51 Largest Companies (by Market Caps)

with 2 comments

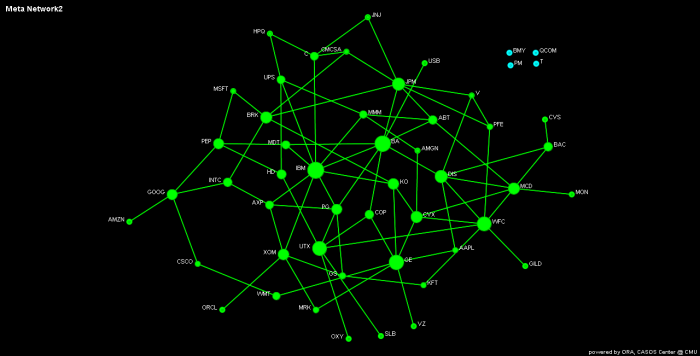
I tried to map the directorship interlocks among the companies.

The data sources are from:

  • Finviz (I used the screener to find the largest companies – as per 4 February 2010)
  • Reuters (the list of directors for each company)

Software used:

  • Ucinet (For the creation of affiliation matrices derived from the DL file)
  • ORA (For the visualiation)

The results are here:

  • Directorship Interlocks Map – the larger the node size the higher the betweenness of the company top 51
  • List of Directors & Company Abbreviations List (http://www.box.net/shared/d1nant9r9a)

The top 10 companies with the highest betweenness centrality are as follows:

  • IBM – INTL BUSINESS MAC
  • BA – BOEING CO
  • GE – GEN ELECTRIC CO
  • WFC – WELLS FARGO & CO
  • UTX – UNITED TECH
  • JPM – JP MORGAN CHASE C
  • DIS – WALT DISNEY-DISNE
  • MCD – MCDONALDS CP
  • BRK – BERKSHIRE

I will come up with more statistical measures of the network in the subsequent post.

Written by Mat

February 7, 2010 at 9:42 am

10 Keys to Innovation

leave a comment »

The best way to coax ideas is to be systematic. Imagine that what follows is like a bunch of keys. Work through them one by one. Some may not be helpful but others may unlock entrepreneurial potential.

  1. Reinvent the Familiar
  2. Improve the Familiar
  3. Reduce Loss
  4. Solve Problems
  5. Take What Nobody Wants
  6. Make the Expensive Cheap
  7. Get the Price Right
  8. Add Value
  9. Invent A Name
  10. The Master Key (i.e. Social Acceptance)

Source: How to be a Successful Entrepreneur

Written by Mat

September 16, 2009 at 8:41 pm

Posted in Knowledge Management

Tagged with

Value of Knowledge Management

leave a comment »

Following are some extract for Marina du Plessis article titled “Drivers of Knowledge Management in the Corporate Environment”

….the value that knowledge management adds lies in:

  • Creating collaboration forums where knowledge can be created and shared, that can act as a catalyst for decisions and actions to be taken based on knowledge shared or created in these forums, in order to maximise opportunities.
  • Retaining knowledge created and shared through collaboration forums and making it available for reuse later in a different context.
  • Mining of internal business information and external information (including customer oriented information), turning it into knowledge through the use of knowledge management tools, e.g. business intelligence, whereby trends relating to the business and its external environment can be identified and acted upon.
  • Increasing individual, team and organisational efficiency through the use of collaboration forums.
  • Centralising access to knowledge, thus providing one view of a particular subject or area, e.g. customer knowledge.

Based on the above, the overarching objective of knowledge management according to the
author is thus to create, share, harvest and leverage knowledge in order to:

  • Initiate action based on knowledge.
  • Support business strategy implementation and realisation of business objectives.
  • Create an intelligent enterprise through.
    1. Retention of corporate and individual knowledge.
    2. More accurate prediction of important opportunities.
    3. Growth of the corporate knowledge base.
  • Increase competitive advantage.
  • Create an innovative culture and environment.
  • Entrench collaboration as a work practice.
  • Improve work efficiency, i.e. increased organisational capacity through:
    1. Improved decision making.
    2. Improved customer service.
    3. Improved solution of business problems.
    4. Increased productivity.
    5. Improved leveraging of corporate and individual knowledge.

Full article here.

Written by Mat

September 14, 2009 at 7:07 pm

Driving Innovation Through Networks

leave a comment »

The following five practices can be used to overcome the barriers that undermine many organizations’ ability to identify and execute innovation opportunities:

  1. Create a network-centric ability to sense and respond to opportunities. Building awareness of who knows what in a network is critical for people to tap the right expertise at the right time.
  2. Develop an ability to rapidly test and refine an opportunity. Mapping decision-making networks so that emerging opportunity can be tried rapidly.
  3. Work through people in specific network positions. Engage people who are information brokers who can reach out to other key connectors in the network. The idea is to bring diversity of people to work on the new idea as it  is critical to its quality and to the ease of implementation (i.e. preventing the idea to be developed in isolation).
  4. Leverage energy. Mapping enthusiasm in networks to indicate who makes them feel energized provides a powerful indicator of where creativity and innovation are occurring.
  5. Ensure that organizational context supports collaboration. Simply introducing a collaborative technology, tweaking incentives, or advocating cultural programs to boost collaboration is insufficient. What is also required is the alignment of unique aspects of formal organization design, control systems, technology, and human resource practices. Specific cultural values and leadership can also have striking effects of collaboration.

Source: Chapter 3 of Driving Results Through Social Networks: How Top Organizations Leverage Networks for Performance and Growth by Rob Cross

Written by Mat

March 29, 2009 at 9:53 pm

What does it mean to practice Knowledge Management?

leave a comment »

What is it that people actually do when they say they practice Knowledge Management? And why? They generally have two objectives. First they nurture the creation of new knowledge in order to speed up innovation and gain a competitive advantage. Second, by sharing existing knowledge they try to increase efficiency, i.e. prevent the wheel from being invented twice.

Christian van ‘t Hof further discussed three main activities related to the practice of knowledge management to achieve the two objectives mentioned earlier, namely:

  1. Cultivating the corporate repository (intranet, wiki, etc.)
  2. Connecting Experts through Yellow Pages (knowledge mapping)
  3. Building communities of practice

Yup, that’s it.

Source: The Practice of Managing Knowledge

Written by Mat

March 24, 2009 at 5:42 pm

What can social networks identify?

leave a comment »

What can be expected from doing a social network analysis within an organization? What can be identified by analyzing the social networks?  According to The Leadership Alliance, here are some:

  • Bottlenecks in key business processes;
  • What would happen to a team if key members left;
  • Sources of informal influence;
  • Employees who connect to the far reaches of the organisation;
  • A good candidate for managing a key department or a new department;
  • Boundary spanners between contiguous network structures i.e. ‘silos of expertise’;
  • Degree of employee collaboration and interactivity;
  • “High Potentials”; and
  • Opinion leaders

Social Networks Analysis can also provide indicators for monitoring:

  • The informal leadership of specific groups;
  • Influencers on products/processes/services;
  • Product/process experts (‘hubs’ and ‘authorities’);
  • Fragmentation and ‘structural holes’; and
  • The ‘reach’ of people (their influence)

Note: A social network analysis can be effectively done for a network group size between 25-300 (according to Andrew Parker – the co-author of The Hidden Power of Social Networks). If we do it for a network group with size of more than 300, it can be to time consuming especially for the person who have big personal network and if we do it for a network group size of less than 25, the group would have already known the result of analysis anyway.

Written by Mat

March 24, 2009 at 5:27 pm

Dave Snowden’s Knowledge Management Principles

leave a comment »

Here are the seven Knowledge Management Principles according to Dave Snowden of Cognitive Edge:

  1. Knowledge can only be volunteered it cannot be conscripted.
  2. We only know what we know when we need to know it.
  3. In the context of real need few people will withhold their knowledge.
  4. Everything is fragmented. We evolved to handle unstructured fragmented fine granularity information objects, not highly structured documents.
  5. Tolerated failure imprints learning better than success.
  6. The way we know things is not the way we report we know things.
  7. We always know more than we can say, and we will always say more than we can write down.

Note about point 3: In this podcast, Snowden mentioned that people will share if other people really need it, but if we asked them to share their knowledge and codify them into a database on the basis that other people may need it, chances are people are not going to do it.

Source: Cognitive Edge

Written by Mat

March 22, 2009 at 10:28 pm

Statnet – Software tools for the analysis, simulation and visualization of network data

leave a comment »

This website provides information on, background material for and access to the statnet suite of packages for network analysis. Directions for downloading statnet can be found under Installation on the navigation bar to the left. The packages are written for the R statistical computing environment, so it runs on any computing platform that supports R. If you do not already have R installed, you will need to install it via the main R web resource-site, www.r-project.org. Instructions for installing R can also be found under Installation.

See more at its website: http://statnet.org/

Written by Mat

March 18, 2009 at 9:11 am